The commercial real estate (CRE) sector is currently navigating a period of significant distress, driven by a combination of elevated interest rates, shifting post-pandemic usage patterns, and a looming "maturity wall" of debt.
As nearly $930 billion in CRE loans mature in 2026-up significantly from 2025-the market is witnessing a marked increase in delinquency rates, foreclosure filings, special servicing transfers, and bank accumulation of Real Estate Owned (REO) assets.[1]
This report synthesizes data from 2024 through early 2026 to provide a comprehensive overview of the distress landscape, highlighting the growing opportunities for investors to acquire distressed properties from banks and lenders.
CRE Loan Delinquency Rates (2024-2026)
Delinquency rates across commercial real estate portfolios have surged over the past two years, moving well past pre-pandemic averages. The distress is not uniform; it is heavily concentrated in specific asset classes, particularly office and, increasingly, multifamily properties.
Bank Portfolio Delinquencies
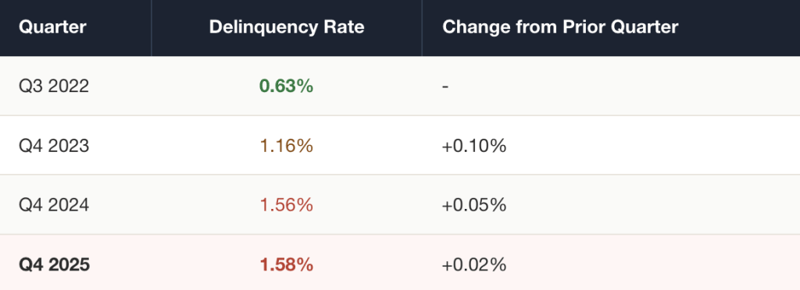
Data from the Federal Reserve indicates a steady and significant rise in CRE loan delinquency rates at commercial banks. The delinquency rate for CRE loans (excluding farmland) booked in domestic offices rose from a trough of 0.63% in the third quarter of 2022 to 1.58% by the fourth quarter of 2025.[2] This represents a 151% increase over that period and places the current rate at more than double the pre-pandemic average of approximately 0.67% to 0.69%.
Table 1 - All Commercial Banks CRE Delinquency Rate
The Federal Deposit Insurance Corporation (FDIC) further highlights the strain on larger institutions. In the fourth quarter of 2025, the non-owner-occupied CRE past due and nonaccrual (PDNA) rate for banks with assets greater than $250 billion stood at 4.06%.[3] While this is a slight decline from a peak of 4.99% in Q3 2024, it remains substantially higher than the pre-pandemic average of 0.58%.
CMBS Delinquencies by Asset Class
The Commercial Mortgage-Backed Securities (CMBS) market provides a granular view of distress by property type. According to CRED iQ, the overall CMBS delinquency rate reached a cycle peak of 9.60% in March 2026, having more than tripled from 2.93% in July 2022.[4] The overall distress rate, which includes specially serviced loans, hit an all-time high of 12.07% in the same month.
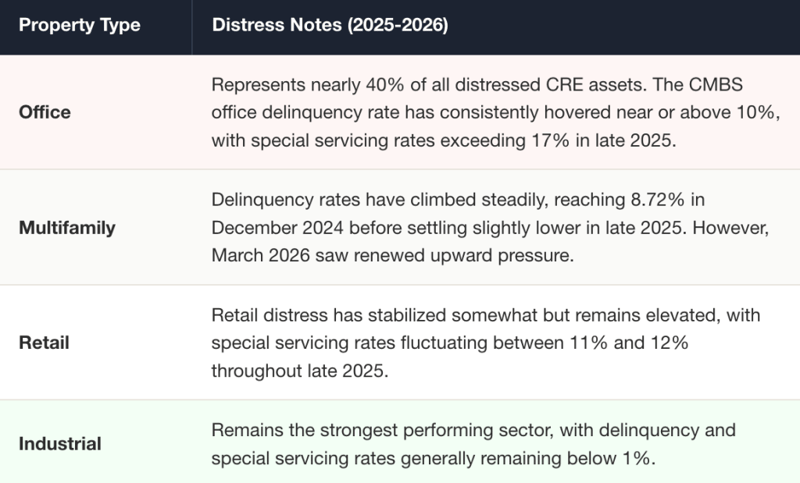
Table 2 - CMBS Delinquency/Distress by Property Type
Default and Foreclosure Filings
The increase in delinquencies has naturally translated into a higher volume of default notices, lis pendens, and foreclosure filings. While commercial foreclosure processes can be lengthy, the data shows a clear upward trajectory in lenders taking action to recover collateral.
National Foreclosure Trends
According to ATTOM Data Solutions, lenders started the foreclosure process on 289,441 U.S. properties in 2025, representing a 14% increase from 2024.[6] Bank repossessions (REOs) also surged, with 46,439 properties repossessed in 2025, a 27% year-over-year increase.
Regional Focus: Illinois and Cook County
The distress is particularly acute in certain major metropolitan areas. Illinois ranked as having the fourth-worst foreclosure rate in the United States in 2025, with one in every 248 units facing a filing.[6] The Chicago MSA recorded the second-highest number of foreclosure starts in the nation (13,312) and the highest number of REOs (2,033). This concentration of distress in Cook County presents a target-rich environment for investors seeking to acquire distressed assets from local and regional lenders.
CMBS Special Servicing Rates
The transfer of a CMBS loan to special servicing is a leading indicator of severe distress, signaling that a default has occurred or is imminent. The data from Trepp reveals a dramatic and sustained increase in special servicing rates over the past two years.
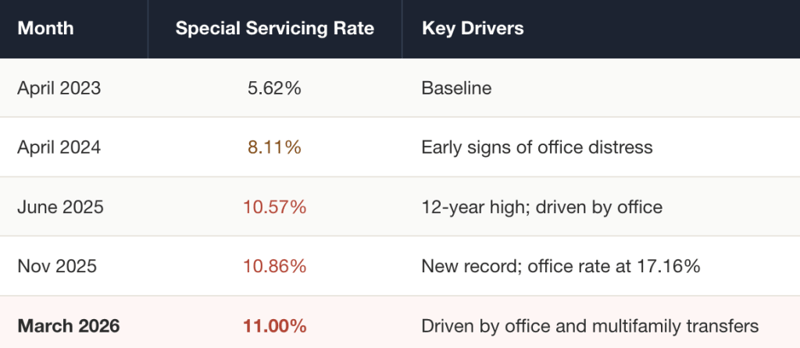
Table 3 - CMBS Special Servicing Rate Trajectory
The composition of specially serviced loans highlights the bifurcation in the CRE market:
Office: The office sector has experienced the most severe deterioration. The special servicing rate surged from 10.52% in May 2024 to a record high of 16.90% in August 2025, eventually peaking above 17% in late 2025.
Multifamily: While lower than office, the multifamily special servicing rate has grown significantly, rising from around 5.7% in mid-2024 to over 8% by late 2025.
Lodging and Retail: Both sectors maintain elevated special servicing rates, generally hovering around 10% to 12%.
Bank REO (Real Estate Owned) Inventory
As foreclosure activity increases, banks are inevitably accumulating more distressed commercial real estate on their balance sheets. This accumulation of Other Real Estate Owned (OREO) ties up capital and creates regulatory pressure, motivating banks to offload these assets, often at a discount.
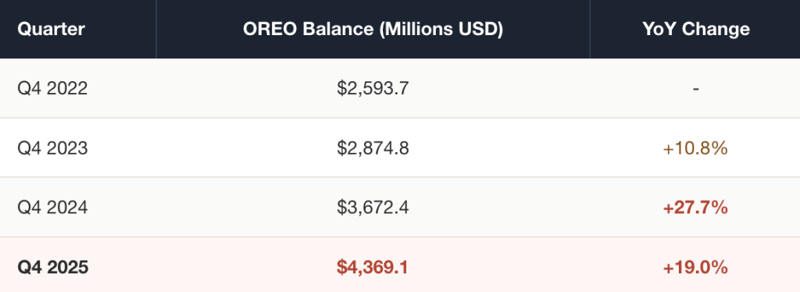
Table 4 - Bank OREO Balance Accumulation
By the fourth quarter of 2025, total bank OREO reached $4.37 billion. This represents a 68.4% increase from the Q4 2022 trough. The combination of rising REO inventory and a massive wave of upcoming loan maturities creates a compelling opportunity for well-capitalized investors.
"Approximately $930 billion of commercial real estate loans will mature in 2026, up significantly from 2025, and at least $126 billion of this amount is considered to be distressed." - ForvisMazars, March 2026 [1]
As Burke Davis, Head of Real Estate Banking at J.P. Morgan, noted in early 2026, "Lower quality space is at risk of obsolescence. That could mean upgrades, but more likely repurposing buildings for different uses."[11]
Comparison: Current Distress vs. 2008-2010 Financial Crisis
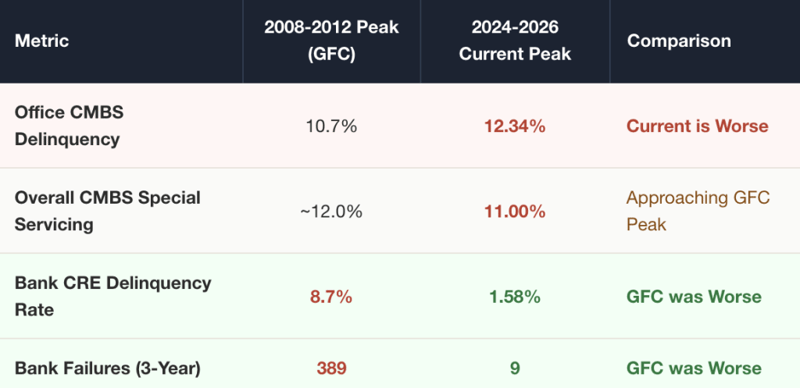
A common thesis among investors is that the current commercial real estate distress is nowhere near the severity of the 2008-2010 Global Financial Crisis (GFC). However, a closer examination of the data reveals a more nuanced picture: while the systemic risk to banks is significantly lower today, the asset-level distress-particularly in the office sector-has actually surpassed GFC peaks in several key metrics.
Table 5 - GFC vs. Current Distress Comparison
Conclusion
The thesis that current distress is "nowhere near 2008 levels" is only half true. For the banking system as a whole, the current environment is far more stable.
However, for the office sector and CMBS investors, the current distress has already surpassed the worst days of the Financial Crisis, creating a highly targeted but historically severe opportunity for distressed asset buyers.
References
[1] ForvisMazars. "Navigating Distressed Properties in Commercial Real Estate." March 23, 2026. forvismazars.us
[2] Federal Reserve Economic Data (FRED). "Delinquency Rate on Commercial Real Estate Loans (Excluding Farmland)." fred.stlouisfed.org